Silicon wafer thickness
- Description
- Thickness of a single wafer, measured at 9 locations for 184 consecutive batches. A single wafer is removed from a tray of wafers (always at the same position for each batch of wafers) after the chemical vapour decomposition process is complete.
- Data source
- Industrial data (origin unknown). The data have been approximately centered and scaled to disguise the original variables - for confidentiality.
The location of the 9 thicknesses are:
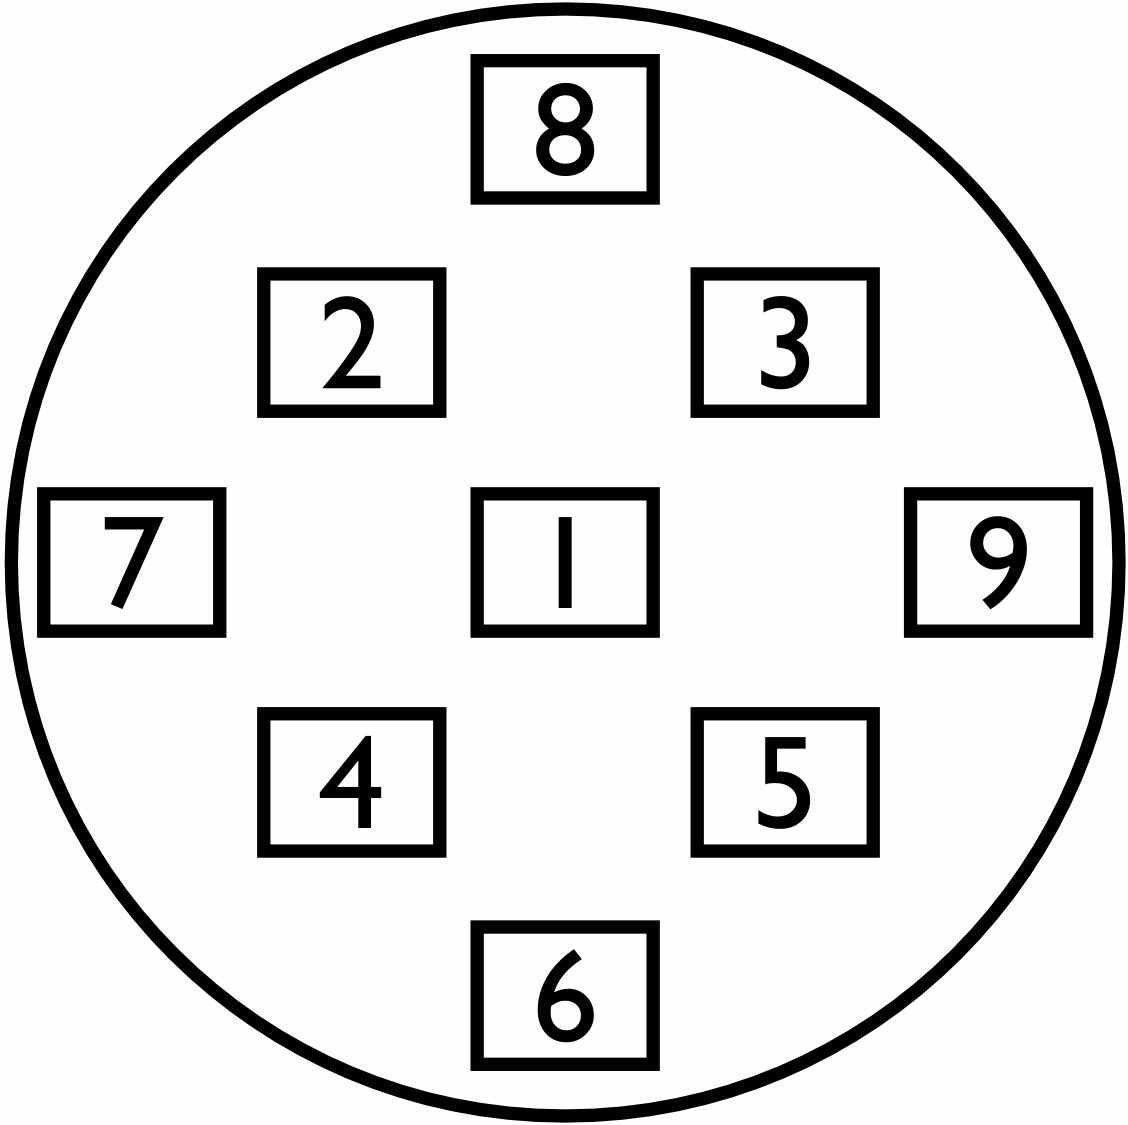
- Data shape
- 184 rows and 9 columns
- Usage restrictions
- None
- Contact person
- Kevin Dunn
- Contact details
- [email protected]
- Added here on
- 27 March 2011 20:45
- Last updated
- 11 November 2018 16:35
Load this dataset in Python
import pandas as pd

df = pd.read_csv("https://openmv.net/file/silicon-wafer-thickness.csv")
df.describe()
Preview (first 10 rows)
| G1 | G2 | G3 | G4 | G5 | G6 | G7 | G8 | G9 |
|---|---|---|---|---|---|---|---|---|
| 0.175 | 0.188 | -0.159 | 0.095 | 0.374 | -0.238 | -0.8 | 0.158 | -0.211 |
| 0.102 | 0.075 | 0.141 | 0.18 | 0.138 | -0.057 | -0.075 | 0.072 | 0.072 |
| 0.607 | 0.711 | 0.879 | 0.765 | 0.592 | 0.187 | 0.431 | 0.345 | 0.187 |
| 0.774 | 0.823 | 0.619 | 0.37 | 0.725 | 0.439 | -0.025 | -0.259 | 0.496 |
| 0.504 | 0.644 | 0.845 | 0.681 | 0.502 | 0.151 | 0.404 | 0.296 | 0.26 |
| 0.57 | 0.729 | 0.879 | 0.624 | 0.588 | 0.204 | 0.435 | -0.018 | 0.354 |
| 0.885 | 0.932 | 0.878 | 0.662 | 0.839 | 0.917 | 0.593 | 0.252 | 0.801 |
| -0.029 | 0.065 | 0.258 | 0.078 | -0.053 | -0.456 | -0.153 | -0.356 | -0.379 |
| 1.396 | 1.461 | 1.342 | 1.122 | 1.394 | 1.408 | 0.924 | 0.638 | 1.375 |
| 0.389 | 0.428 | 0.332 | 0.466 | 0.35 | 0.539 | -0.159 | -0.459 | 0.259 |